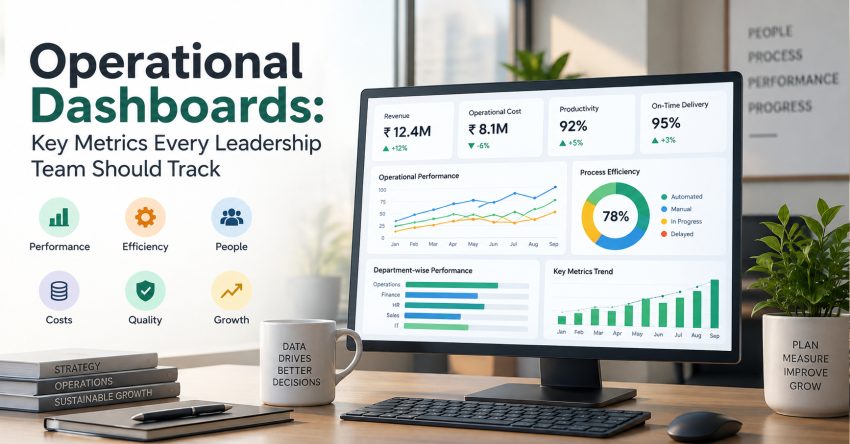
Business leaders need visibility into what is happening across the organisation, not only at the end of a quarter but every day. This visibility can be realized on operational dashboards by consolidating key performance information. Leadership teams can track important indicators and find out if there are changes to address rather than going through long reports or multiple spreadsheets.
Operational Dashboards are an integral part of effective business operations management, since they integrate day-to-day activities with business goals. If leaders monitor the right measures regularly, they can make quicker decisions, solve inefficiencies and remain engaged with organisational priorities.
What is an Operational Dashboard?
An operational dashboard is a single source of real-time or regularly changing business information. It provides decision makers with key performance indicators (KPIs) in a simple format, enabling them to quickly understand performance and determine whether operations are on track.
A good dashboard is not supposed to show all the metrics. Rather, it should be about information that affects operational performance and business outcomes.
1. Revenues and Sales Effectiveness
Financial performance remains an essential aspect of business health. It is imperative that the management team evaluates those metrics that will give them a hint of whether sales performance helps to make the business sustainable.
Relevant metrics are:
- Revenue growth
- Sales conversion ratio
- Order value
- Sales pipeline value
- Customer acquisition cost
Those metrics will be helpful for the leaders to evaluate changes in demand and to evaluate whether sales effectiveness corresponds to the goals of the business.
2. Operational Efficiency
Efficiency measures indicate whether resources are being used effectively. They can assist in the identification of bottlenecks, process delays and areas that might need improvement.
Depending on the organisation, leadership teams can monitor:
- Process completion time
- Productivity per employee
- Resource utilisation
- Process error rates
Cost per transaction
These indicators help in tracking business operations more effectively and help identify areas of improvement.
3. Customer Experience
Strong operations should ultimately contribute to a positive customer experience. The metrics to include in a dashboard should, therefore, be a reflection of how customers interact with the organisation.
These can range from customer satisfaction scores, response times, complaint volumes, retention rates, and service resolution times.
If complaints or responses suddenly increase, for instance, the operational problem could be a serious issue that requires on-the-spot attention.
4. Workforce Performance
Individuals play a pivotal role in everyday activities. Dashboards can track workforce-related metrics beyond employee headcount.
Any of the following metrics may be relevant:
- Attendance and availability
- Employee productivity
- Staff turnover
- Training completion
- Workload distribution
These can be used as indicators to help detect capacity problems and as part of workforce planning.
5. Quality and Risk Indicators
Quality-related metrics are used to highlight problems that are likely to be bigger operational challenges. Defects and rework, compliance issues, incidents, and process deviations can be monitored through leadership dashboards.
Regular monitoring of these indicators can shift the focus from solving problems when they occur to taking preventative measures.
6. Financial and Resource Indicators
Making operational decisions can have a financial impact as well. Monitoring cash flows, stocks, purchasing, and resource utilization allows leadership teams to understand whether their operations are sustainable.
This information is particularly valuable when organizations grow fast and respond to market dynamics.
How to Build Effective Dashboards for Leadership Teams
A dashboard becomes useful when it can be used to take action. Avoid having too many metrics on dashboards that do not impact decision making.
The best dashboard should:
- Keep a limited number of meaningful KPIs to focus on
- Use clear and consistent definitions:
- Emphasize key changes and trends
- Assign accountability for key metrics
- Link operational metrics to strategic goals.
Conclusion
Operational dashboards allow leadership teams to have a more transparent picture of the organisation’s performance in terms of sales, efficiency, customers, workforce, quality, and financial resources. When implemented as part of operations management within the business, they can help management detect issues earlier, allocate resources effectively, and maintain better visibility into current business performance.
It’s not just about gathering more information. It’s about making data from relevant operations useful information that supports the business and gives assurances in the face of change.
Turn operational data into actionable insights for faster decisions. CAC helps organisations build effective dashboards aligned with business goals.
Frequently Asked Questions
Q: What is an operational dashboard?
An operational dashboard is a centralised view of real-time or regularly updated business information. It presents important key performance indicators (KPIs) in a clear format so leadership teams can understand current performance, identify changes and make informed operational decisions.
Q: Which metrics can be used to measure operational efficiency?
Operational efficiency can be monitored through metrics such as process completion time, employee productivity, resource utilisation, process error rates and cost per transaction. These indicators can help identify bottlenecks, delays and areas where processes may require improvement.
Q: Why should operational KPIs be linked to strategic goals?
Linking operational KPIs to strategic goals helps leadership understand whether everyday business activities are contributing to broader organisational priorities. It also prevents dashboards from becoming collections of metrics that do not meaningfully support decision-making.
Also Read: Unlocking Competitive Advantage Through Business Operations Management